PC GAMESS version 7.1.9 benchmarks and scalability on Dunnington-based system (four six-core Intel Xeons MP L7455 with twenty four CPU cores in total).


Performance

Number of cores used

Test 1, CPU time

Test 2, Wall clock time

Test 3, CPU time

Test 4, Wall clock time

Test 5, CPU time

Test 6, CPU time

Standard MP4(SDTQ) benchmark, Wall clock time

Standard MCQDPT2 benchmark, Wall clock time

1

3560.0

220.6

6473.3

880.9

5338.8

21155.3

7140.4


2

1794.1

148.1

3176.0

473.8

2727.5

10663.5

3798.0


3

1218.6

121.9

2131.7

383.9

1865.2

7155.8

2651.2


4

930.5

108.0

1613.5

277.2

1448.4

5432.0

2079.3


5

761.3

100.8

1298.2

227.4

1213.5

4421.0

1760.8


6

653.2

97.7

1090.9

190.5

1089.3

3742.1

1523.9

91102.0

7

562.4

95.7

920.0

170.2

1001.8

3306.2

1395.9


8

507.0

90.8

834.8

160.0

938.2

2909.2

1249.3


9

470.6

88.0

722.7

142.5

870.7

2658.5

1152.0


10

420.8

84.8

681.0

134.7

870.6

2431.7

1070.0


11

393.0

84.5

626.8

130.3

788.0

2262.2

999.8


12

360.1

84.6

587.6

121.0

786.6

2115.7

947.9

48758.3

13

341.0

84.3

495.5

115.3

759.3

2000.4

906.1


14

321.8

81.2

465.8

109.5

771.3

1868.5

872.1


15

305.1

81.6

481.3

107.2

723.1

1782.2

830.6


16

291.9

79.9

430.6

103.6

726.1

1690.4

803.6


17

280.8

79.7

403.8

103.5

706.0

1628.4

787.1


18

267.9

80.9

396.6

99.1

734.0

1563.7

771.8

34737.5

19

260.0

81.0

399.8

98.3

703.0

1497.1

749.6


20

252.1

82.1

358.1

96.1

693.2

1454.1

732.9


21

246.5

81.9

346.0

95.4

702.5

1410.8

726.0


22

238.6

84.1

326.3

91.6

701.8

1378.3

702.5


23

232.6

83.3

329.1

90.8

690.8

1343.8

697.4


24

234.1

82.5

299.0

89.4

702.7

1362.8

683.3

27669.2


Scalability

Number of cores used

Test 1, relative speedup (%)

Test 2, relative speedup (%)

Test 3, relative speedup (%)

Test 4, relative speedup (%)

Test 5, relative speedup (%)

Test 6, relative speedup (%)

Standard MP4(SDTQ) benchmark, relative speedup (%)

Standard MCQDPT2 benchmark, relative speedup (%)

1

100.0

100.0

100.0

100.0

100.0

100.0

100.0


2

198.4

149.0

203.8

185.9

195.7

198.4

188.0


3

292.1

181.0

303.7

229.5

286.2

295.6

269.3


4

382.6

204.3

401.2

317.8

368.6

389.5

343.4


5

467.6

218.8

498.6

387.4

440.0

478.5

405.5


6

545.0

225.8

593.4

462.4

490.1

565.3

468.6

600.0

7

633.0

230.5

703.6

517.6

532.9

639.9

511.5


8

702.2

243.0

775.4

550.6

569.0

727.2

571.6


9

756.5

250.7

895.7

618.2

613.2

795.8

619.8


10

846.0

260.1

950.6

654.0

613.2

870.0

667.3


11

905.9

261.1

1032.8

676.1

677.5

935.2

714.2


12

988.6

260.8

1101.7

728.0

678.7

999.9

753.3

1121.1

13

1044.0

261.7

1306.4

764.0

703.1

1057.6

788.0


14

1106.3

271.7

1389.7

804.5

692.2

1132.2

818.8


15

1166.8

270.3

1345.0

821.7

738.3

1187.0

859.7


16

1219.6

276.1

1503.3

850.3

735.3

1251.5

888.6


17

1267.8

276.8

1603.1

851.1

756.2

1299.1

907.2


18

1328.9

272.7

1632.2

888.9

727.4

1352.9

925.2

1573.6

19

1369.2

272.3

1619.1

896.1

759.4

1413.1

952.6


20

1412.1

268.7

1807.7

916.6

770.2

1454.9

974.3


21

1444.2

269.4

1870.9

923.4

760.0

1499.5

983.5


22

1492.0

262.3

1983.8

961.7

760.7

1534.9

1016.4


23

1530.5

264.8

1967.0

970.2

772.8

1574.3

1023.9


24

1520.7

267.4

2165.0

985.3

759.8

1552.3

1045.0

1975.5


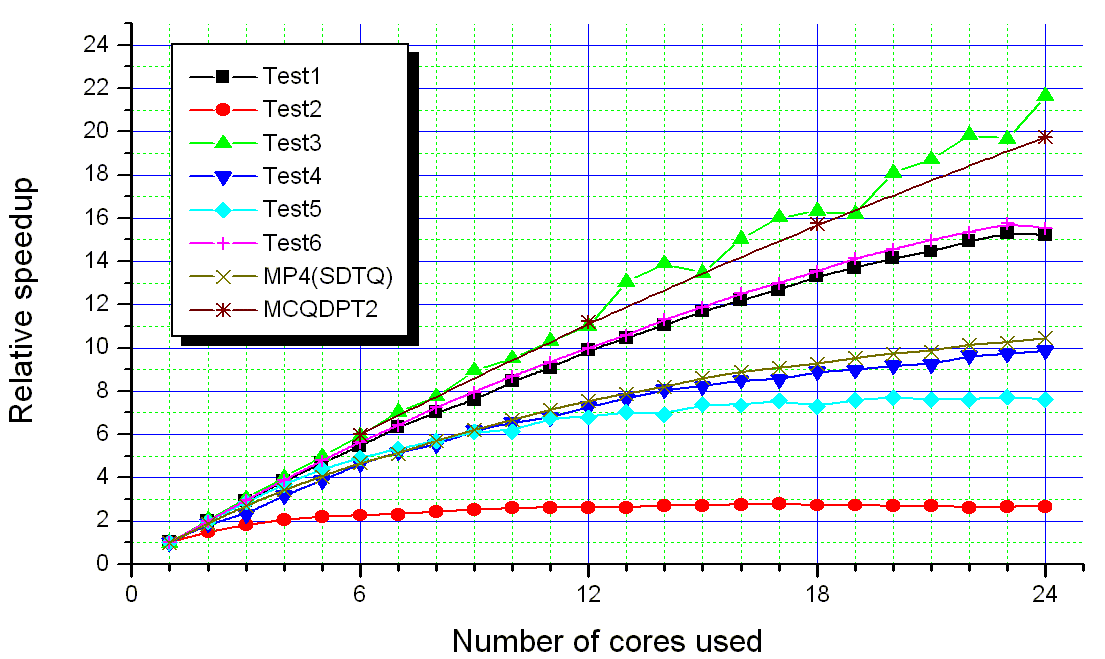
Graphical representation of scalability


OS and hardware description

Chassis

Deer Harbour

Platform

Caneland

Processors

Four Intel Six Core Xeons L7455 MP (Dunnington), 2.13 GHz, 12 MB shared L3 cache, 1066 MHz FSB

Chipset

Clarksboro

Memory

32 GB (16x 2 GB FBD 667MHz)

HDD

2.5” 73 GB SAS

OS: Windows 2003 Enterprise Edition x64 SP 2


Tests description


Test 1, single-point direct DFT (B3LYP) energy plus gradient for medium-size system (623 basis functions). View image

Test 2, single-point semiempirical (PM3) energy plus gradient for large system (540 atoms, 2160 basis functions). View image

Test 3, single-point direct MP2 energy for medium-size system (623 basis functions, the same system as one used for Test 1). View image

Test 4, single-point two-state MCQDPT2 energy with ISA energy denominators shift for small model system. View image

Test 5, single-point direct CASSCF(12,12) for medium-size system (retinal molecule, cc-pVDZ, 565 Cartesian basis functions) using ALDET code. View image

Test 6, single-point direct CIS energy plus gradient of first excited state of medium-size system (porphyrin molecule, cc-pVTZ (aug-cc on Nitrogens), 1130 Cartesian basis functions, D2h group). View image

More data on standard MP4(SDTQ) benchmark

More data on standard MCQDPT2 benchmark


Test comments


Tests 2, 4, as well as standard MCQDPT2 and MP4 benchmarks were run in multithreaded mode, other tests were run in standard parallel mode using dynamic load balancing over p2p interface. Note that test 2 does not scale well mainly due to limitations of the PC GAMESS' semiempirical code, while test 4 would scale much better for larger job. CPU or Wall clock times are given on master node in seconds.


Copyright © 2008 by Alex A. Granovsky

Press to visit PC GAMESS v. 7.1 performance and scalability on 16-core Intel Tigerton (Xeon X7350)-based system page

Press to visit Firefly version 7.1.G Intel dual Quad-core Xeon W5580 benchmarks page

Press to visit PC GAMESS v. 7.0.4 benchmarks and scalability on 21-node Pentium 4 Infiniband Linux cluster page

Press to visit PC GAMESS' Barcelona vs. Clovertown vs. Harpertown performance comparison page

Press to visit PC GAMESS' different eight core systems performance comparison page

Press to visit PC GAMESS' Woodcrest vs. Opteron performance comparison page

Press to visit PC GAMESS Pentium 4 family Xeon processor benchmarks page to compare the results of these benchmarks with those obtained on Xeon DP processors.

Press to visit PC GAMESS Pentium 4 family benchmarks page to compare the results of these benchmarks with those obtained on various Netburst (Pentium 4 and Pentium D) processors.

Press to visit the PC GAMESS vs. WinGamess performance comparison page to compare the results of these benchmarks with those obtained on older processors. Input files can be found there too.