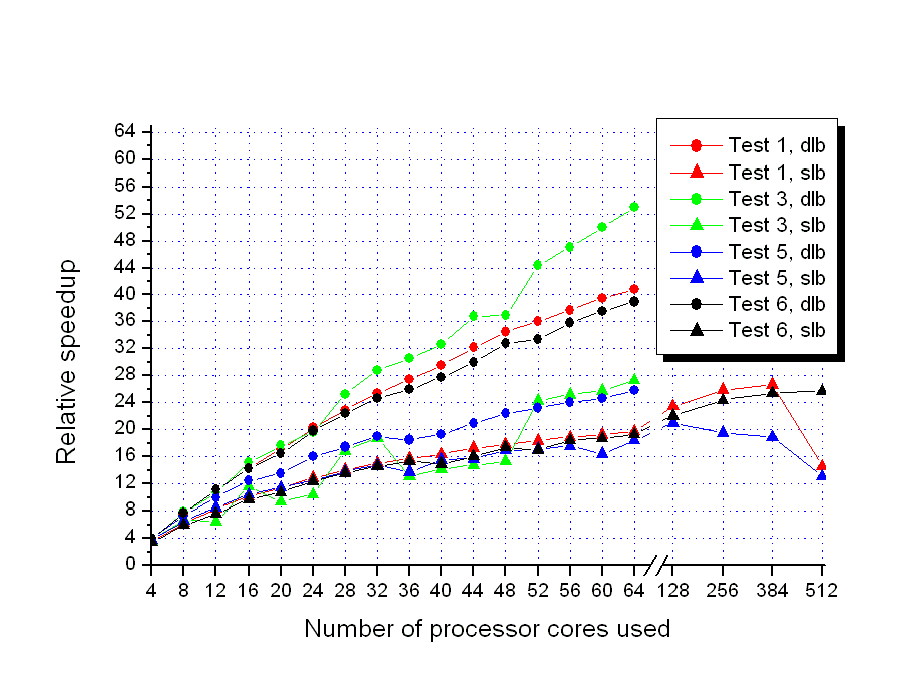
Graphical representation of scalability
|
Number of CPU cores used |
Test 1, dynamic load balancing, Wall clock time and relative speedup |
Test 1, static load balancing, Wall clock time and relative speedup |
Test 3, dynamic load balancing, Wall clock time and relative speedup |
Test 3, static load balancing, Wall clock time and relative speedup |
Test 5, dynamic load balancing, Wall clock time and relative speedup |
Test 5, static load balancing, Wall clock time and relative speedup |
Test 6, dynamic load balancing, Wall clock time and relative speedup |
Test 6, static load balancing, Wall clock time and relative speedup |
|
4 |
996.1 400% |
1145.0 348.0% |
1751.3 400% |
1901.5 368.4% |
2179.4 400% |
2334.7 373.4% |
5416.0 400% |
6324.4 342.5% |
|
8 |
518.9 767.9% |
639.6 623.0% |
897.8 780.2% |
1048.4 668.2% |
1194.3 729.9% |
1336.3 652.4% |
2816.9 769.1% |
3635.5 595.9% |
|
12 |
358.9 1110.2% |
479.3 831.3% |
652.9 1072.9% |
1080.5 648.3% |
870.8 1001.1% |
1018.8 855.7% |
1955.0 1108.1% |
2856.2 758.5% |
|
16 |
278.9 1428.6% |
391.6 1017.5% |
463.6 1511.0% |
605.0 1157.9% |
699.5 1246.3% |
834.4 1044.8% |
1522.3 1423.1% |
2216.5 977.4% |
|
20 |
232.7 1712.2% |
348.0 1144.9% |
397.5 1762.3% |
749.0 935.3% |
644.8 1352.0% |
761.3 1145.1% |
1314.6 1648.0% |
2014.5 1075.4% |
|
24 |
196.7 2025.6% |
309.3 1288.2% |
355.9 1968.3% |
669.0 1047.1% |
545.3 1598.7% |
696.0 1252.5% |
1093.2 1981.7% |
1743.2 1242.8% |
|
28 |
174.1 2288.6% |
283.0 1407.9% |
277.0 2529.0% |
414.5 1690.0% |
500.0 1743.5% |
631.0 1381.6% |
968.6 2236.6% |
1589.9 1362.6% |
|
32 |
157.1 2536.2% |
265.2 1502.4% |
242.9 2884.0% |
373.7 1874.6% |
459.5 1897.2% |
590.3 1476.8% |
879.2 2464.1% |
1489.0 1454.9% |
|
36 |
145.3 2742.2% |
253.6 1571.1% |
229.5 3052.4% |
531.6 1317.8% |
472.0 1846.9% |
633.8 1375.5% |
835.7 2592.3% |
1410.8 1535.6% |
|
40 |
134.9 2953.6% |
243.2 1638.3% |
214.8 3261.3% |
496.7 1410.3% |
451.4 1931.2% |
560.3 1555.9% |
779.6 2778.9% |
1448.0 1496.1% |
|
44 |
123.9 3215.8% |
230.1 1731.6% |
190.4 3679.2% |
473.3 1480.1% |
417.0 2090.6% |
554.5 1572.2% |
722.5 2998.5% |
1351.9 1602.5% |
|
48 |
115.5 3449.7% |
223.4 1783.5% |
189.8 3690.8% |
458.2 1528.9% |
389.0 2241.0% |
515.2 1692.1% |
661.3 3276.0% |
1247.3 1736.9% |
|
52 |
110.5 3605.8% |
216.8 1837.8% |
158.1 4430.9% |
288.3 2429.8% |
375.3 2322.8% |
507.1 1719.1% |
649.3 3336.5% |
1272.1 1703.0% |
|
56 |
105.6 3773.1% |
210.5 1892.8% |
148.8 4707.8% |
278.1 2519.0% |
362.6 2404.2% |
495.5 1759.4% |
604.5 3583.8% |
1173.6 1845.9% |
|
60 |
100.9 3948.9% |
206.7 1927.6% |
140.0 5003.7% |
271.5 2580.2% |
353.7 2464.7% |
530.8 1642.4% |
577.1 3753.9% |
1155.0 1875.7% |
|
64 |
97.6 4082.4% |
201.8 1974.4% |
132.3 5294.9% |
256.0 2736.4% |
338.4 2576.1% |
473.1 1842.7% |
556.2 3895.0% |
1120.7 1933.1% |
|
128 |
n/a |
169.7 2347.9% |
n/a |
n/a |
n/a |
414.4 2103.7% |
n/a |
979.8 2211.1% |
|
256 |
n/a |
153.8 2590.6% |
n/a |
n/a |
n/a |
446.5 1952.4% |
n/a |
886.9 2442.7% |
|
384 |
n/a |
149.3 2668.7% |
n/a |
n/a |
n/a |
460.7 1892.3% |
n/a |
852.0 2542.7% |
|
512 |
n/a |
273.4 1457.4% |
n/a |
n/a |
n/a |
663.9 1313.1% |
n/a |
844.4 2565.6% |